Dashboard
We have developed an amazing LIVE dashboard to give you a bird's eye view of your operations. Engage with your dashboard throughout your day to monitor the health of your operation. The dashboard is divided into 3 major sections.
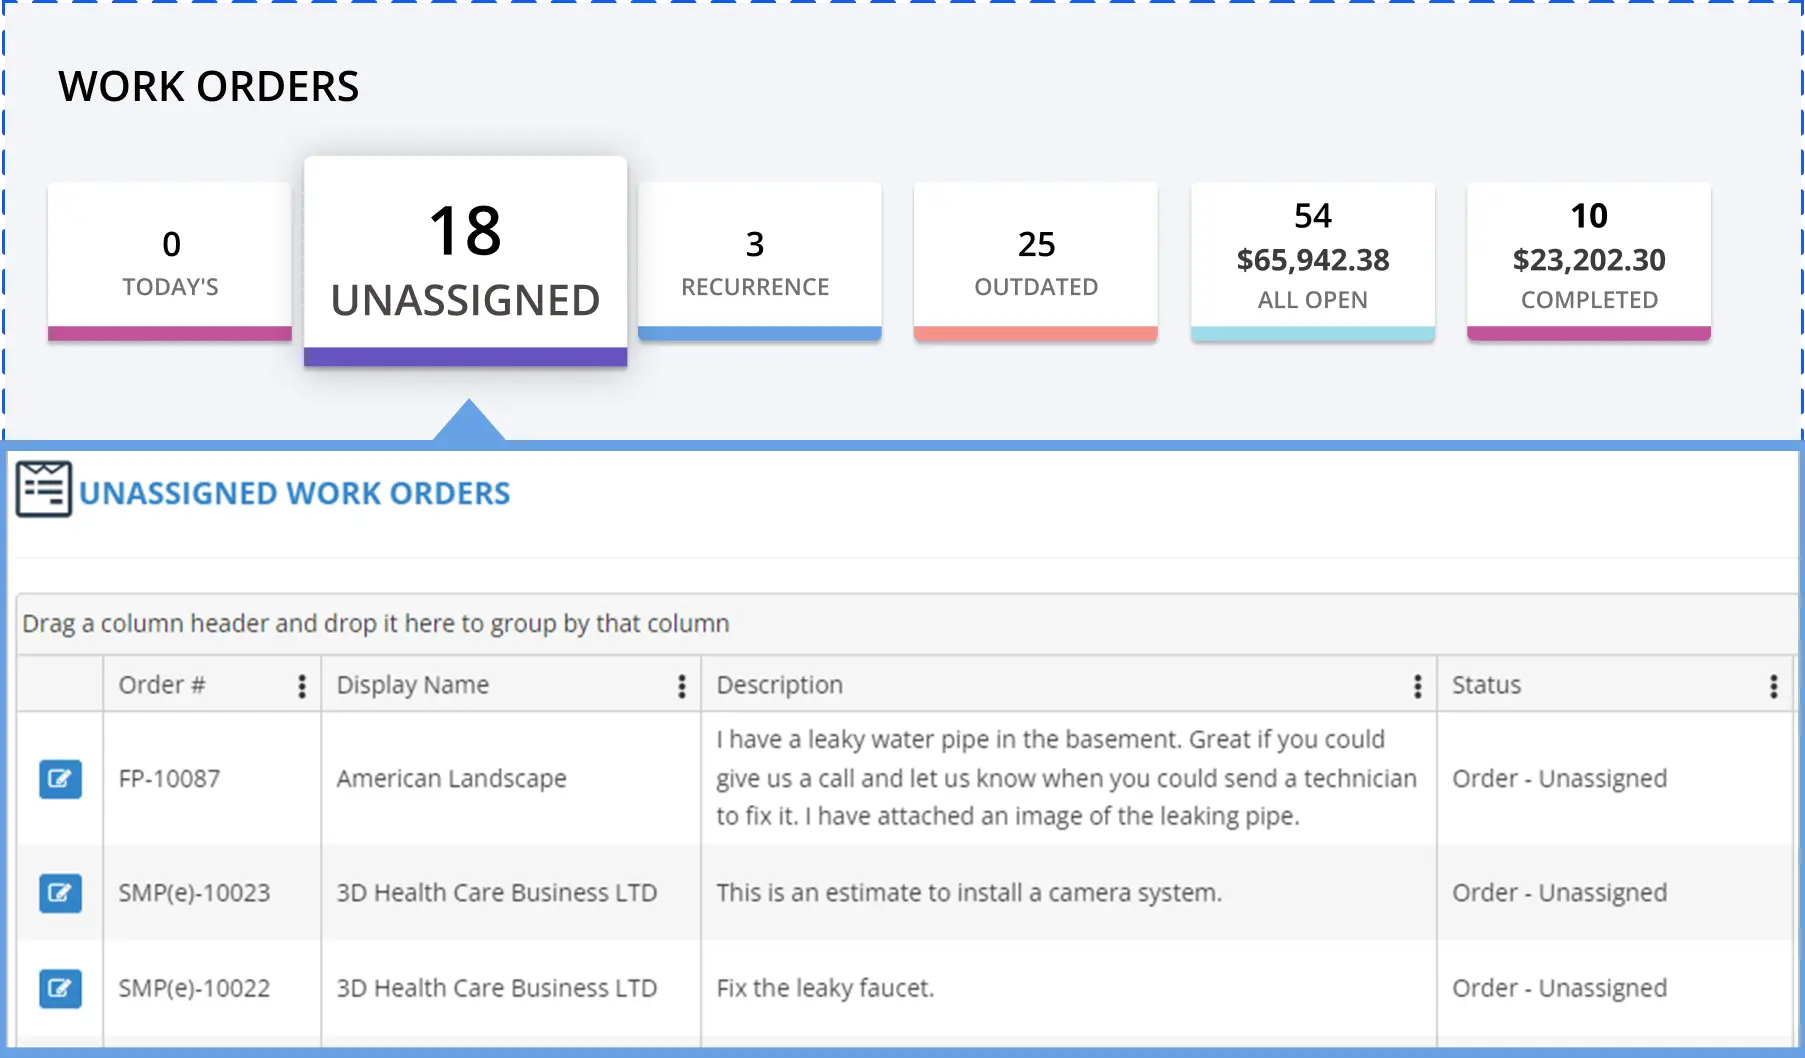
- WORK ORDERS
- PERATIONAL METRICS
- USER ACITIVITIES
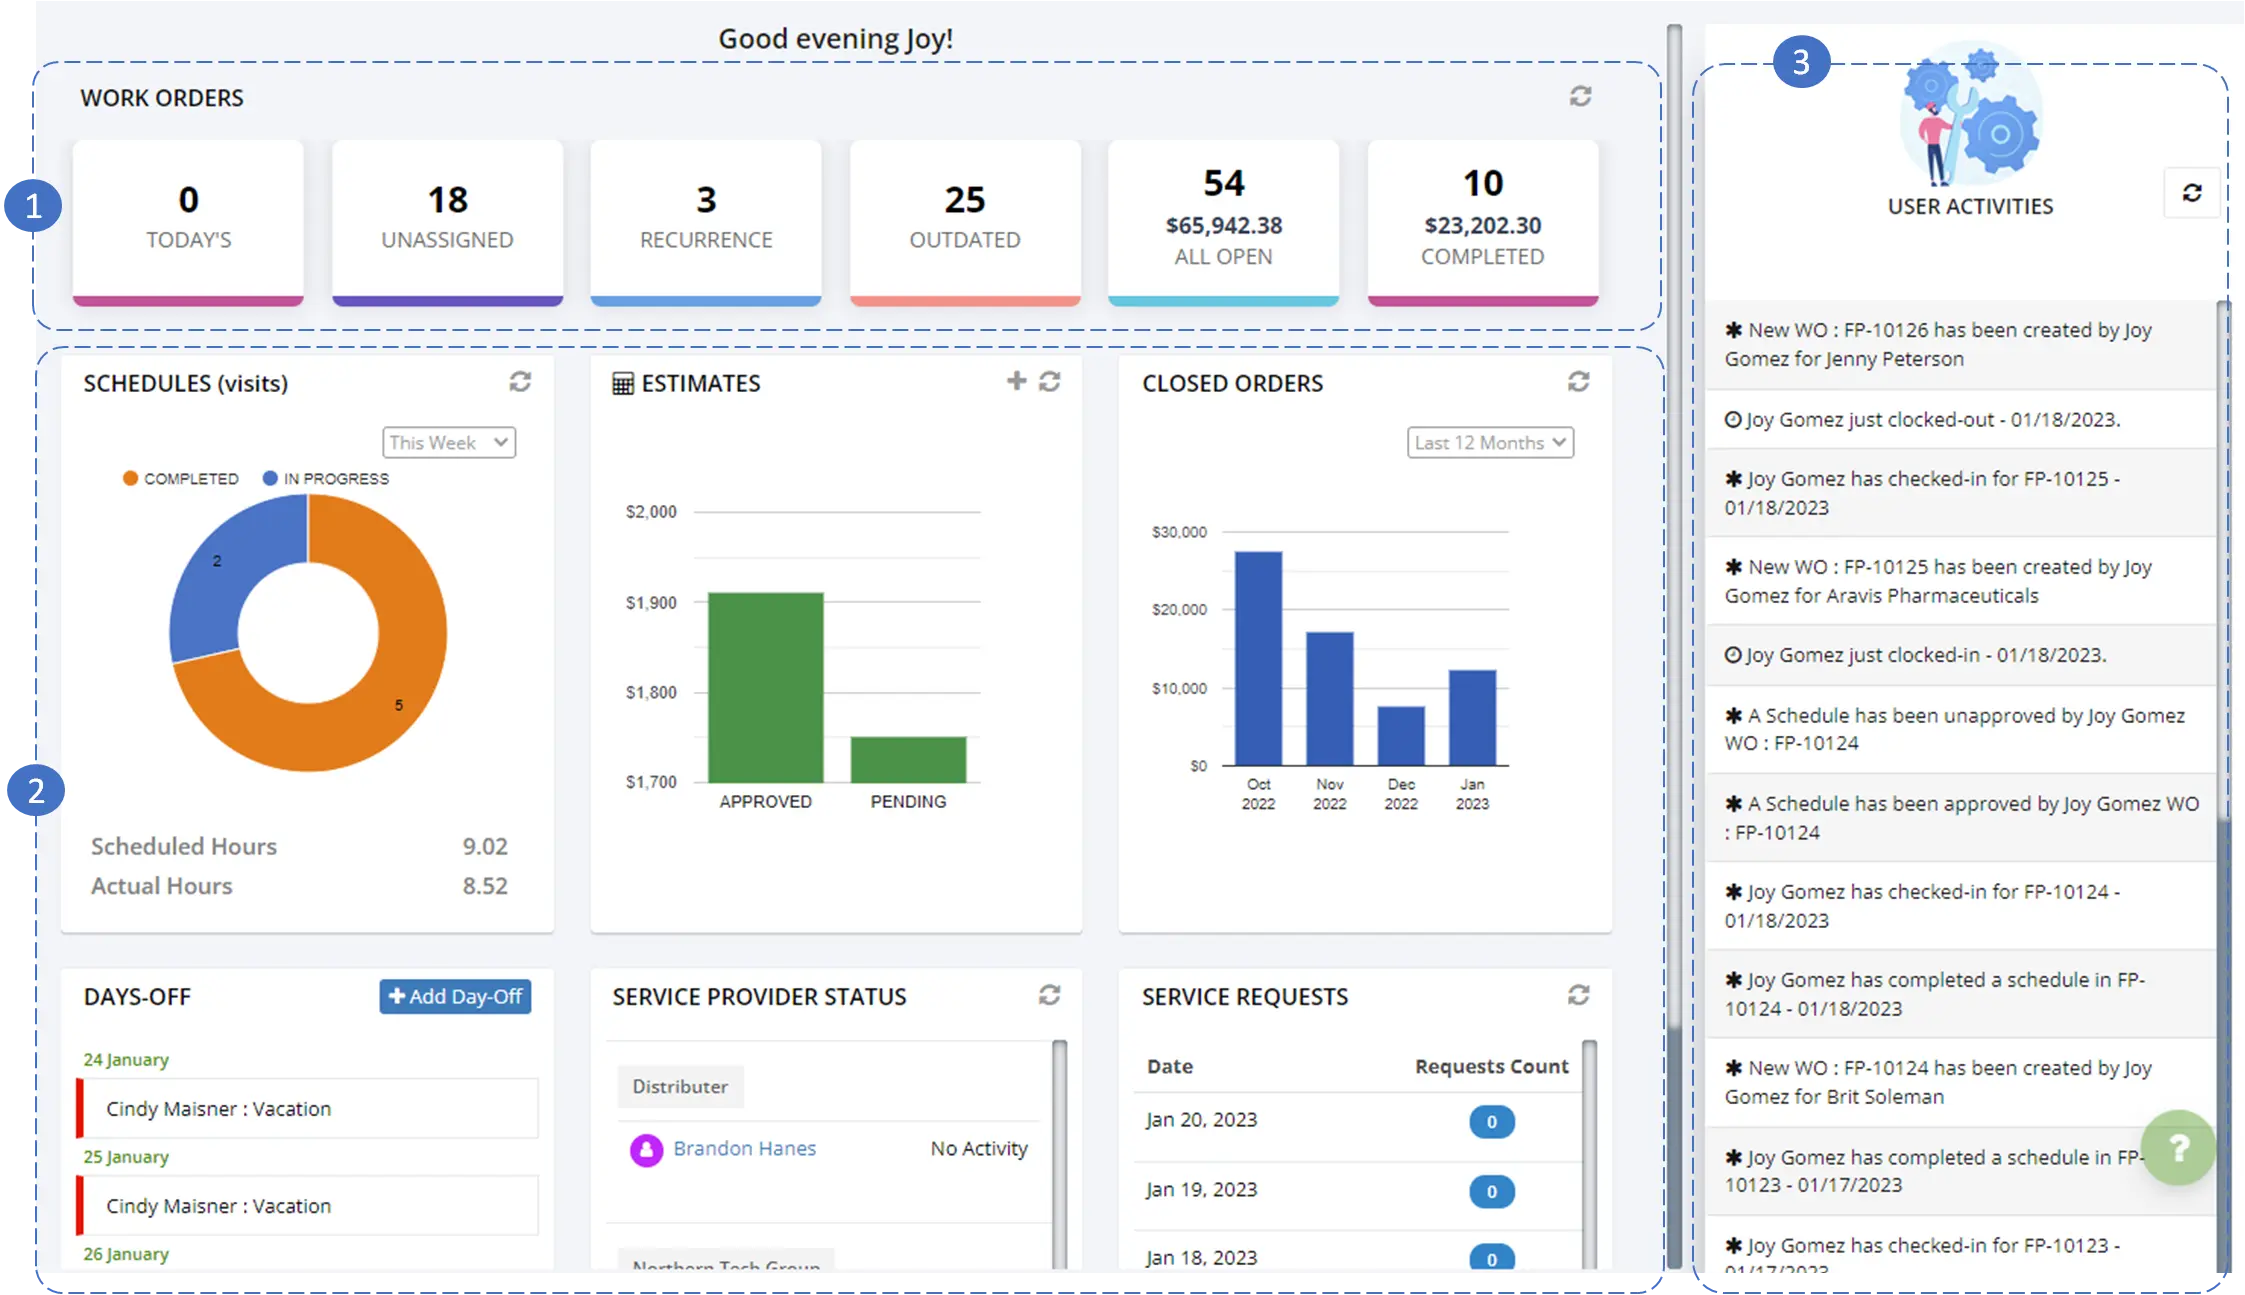
Let’s explore each section.
1. WORK ORDERS: Click on each tile to go into their respective work orders.
2. OPERATIONAL METRICS: Each tile provides further insight into your operation. Click on each tile to interpret and investigate the details
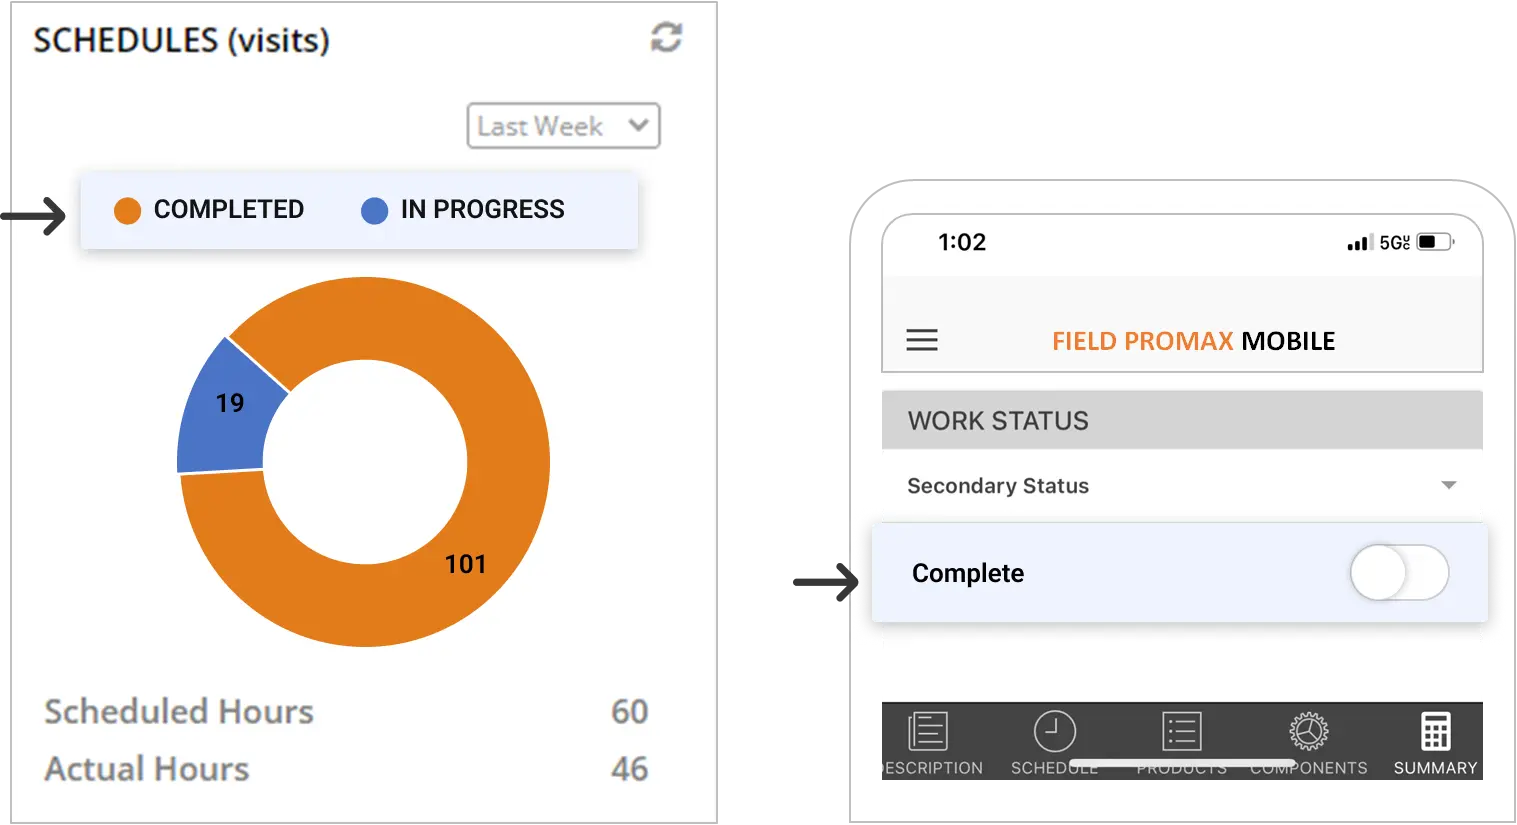
SCHEDULES
- This provides a summary of all the “In Progress” and “Completed” schedules (visits). When your Technicians clicks on “Complete” in the mobile app it is reflected in this graph
- You may also want to investigate why the Actual Hours are different than the Scheduled Hours.
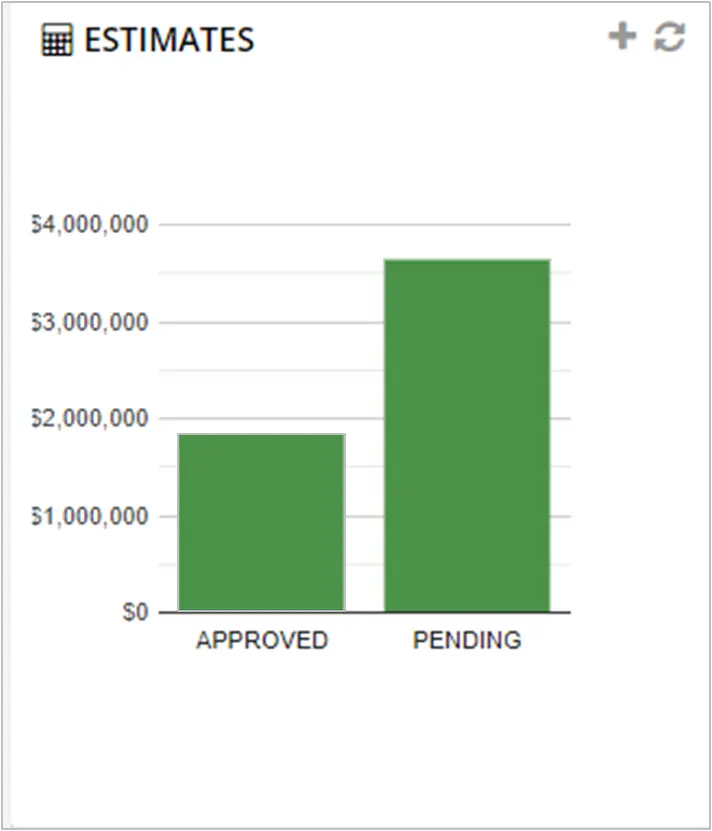
ESTIMATES
- This provides you a quick view of the totals of all “Approved” and “Pending” estimates.
- All Approved estimates would probably require some action to either convert to a work order or to close it out.
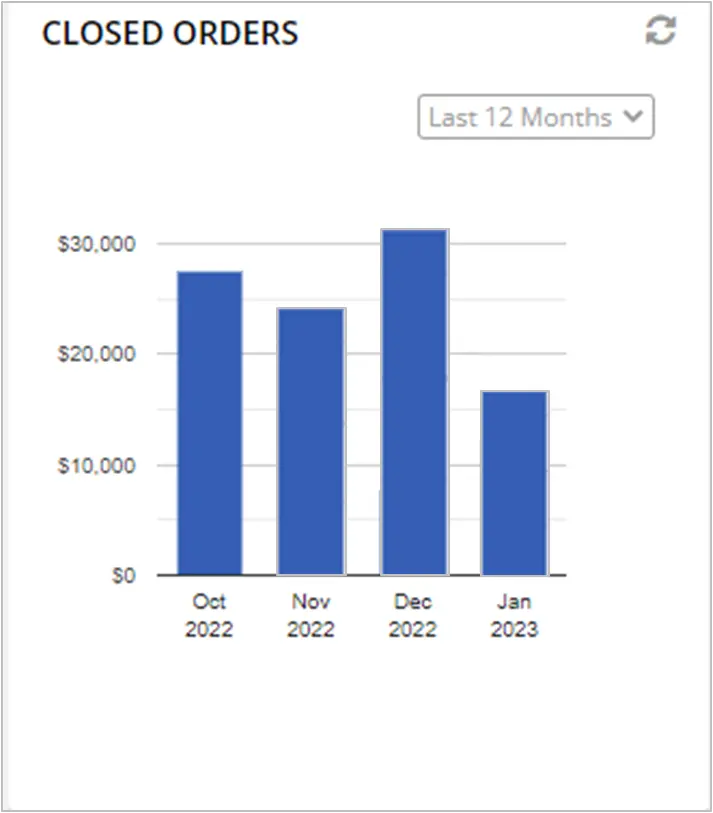
CLOSED ORDERS
- This provides you a trend graph for the past 24 months. Observe year to year trends, to plan the future.
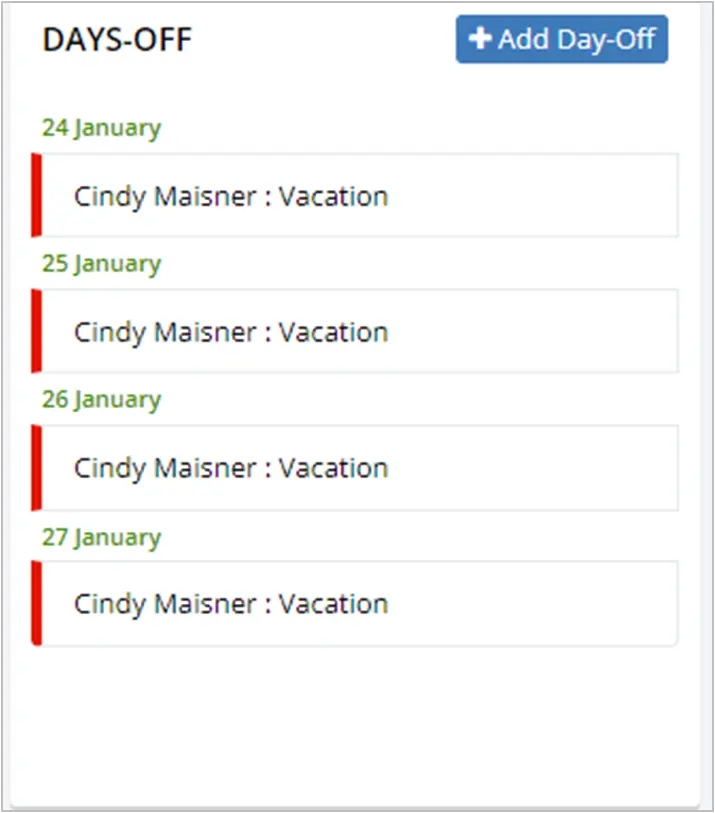
DAYS OFF
- Quickly view upcoming days off to plan daily operations.
- Quickly add days off from this tile.
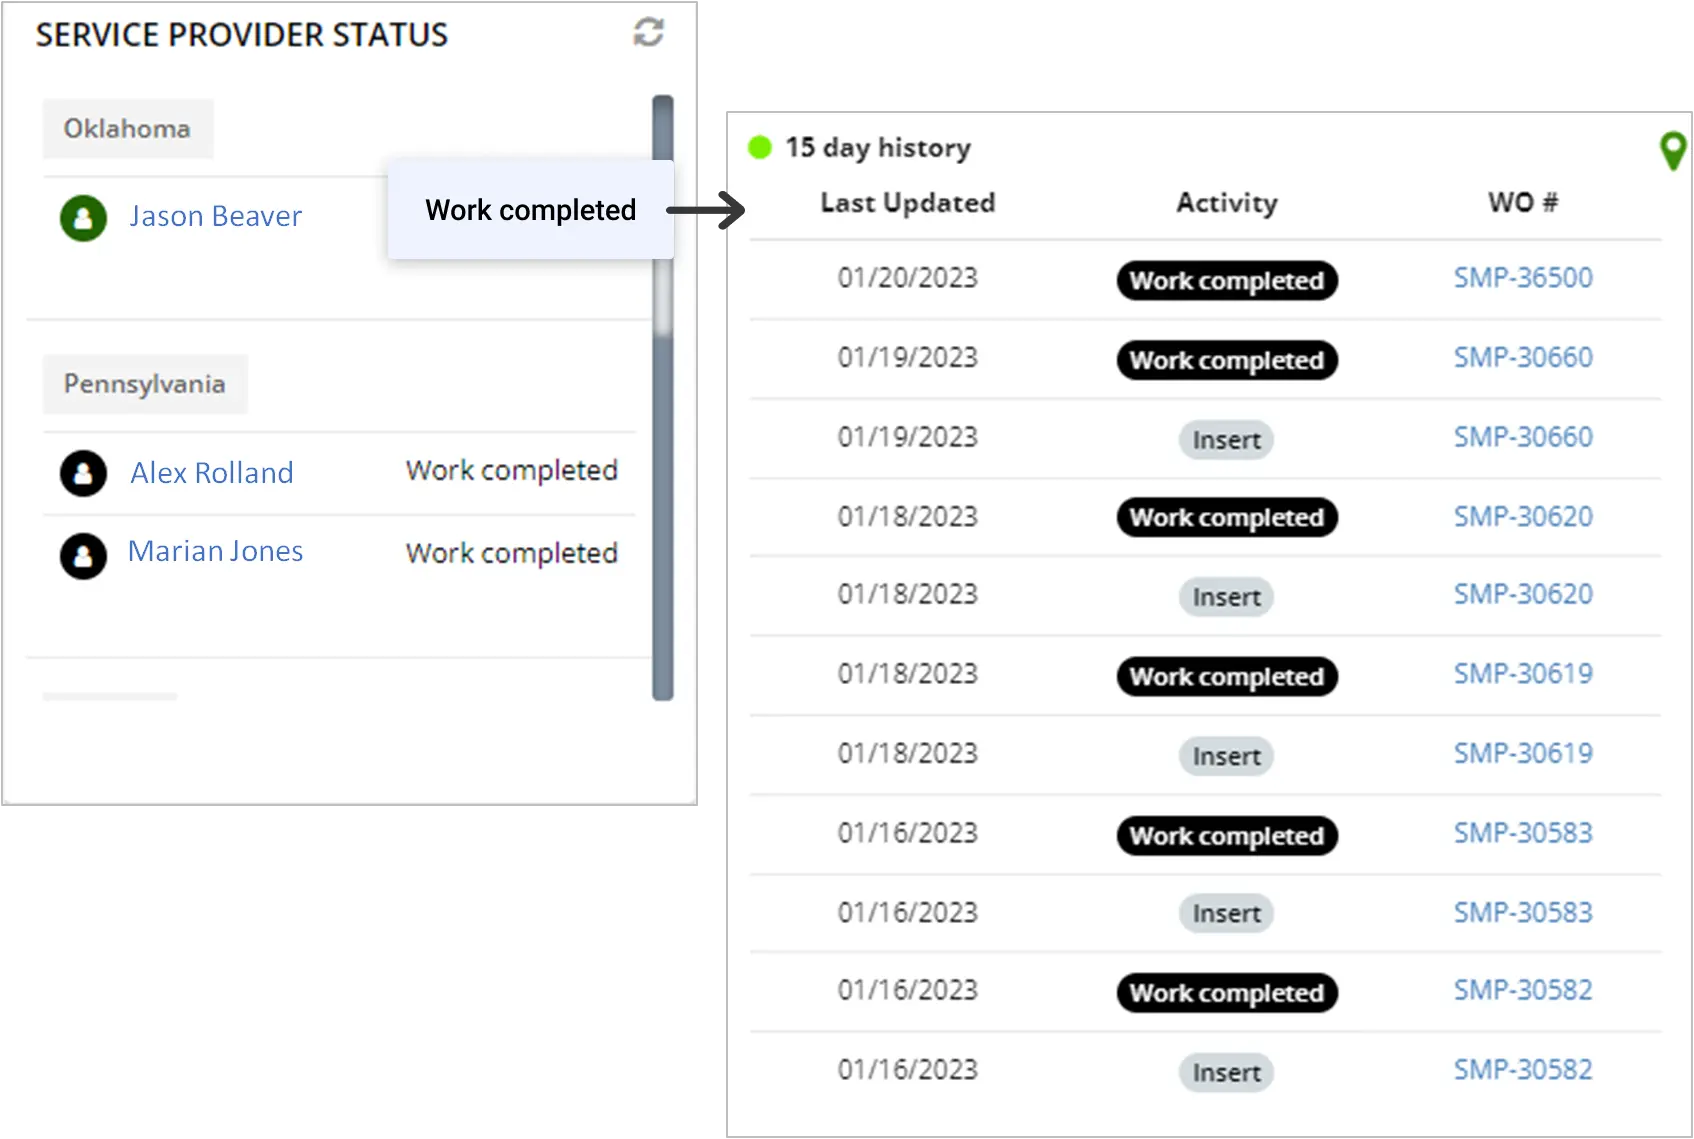
SERVICE PROVIDER STATUS
- This provides a live update of your Technician’s status.
- Click on each Technician to view the last 15-day history.
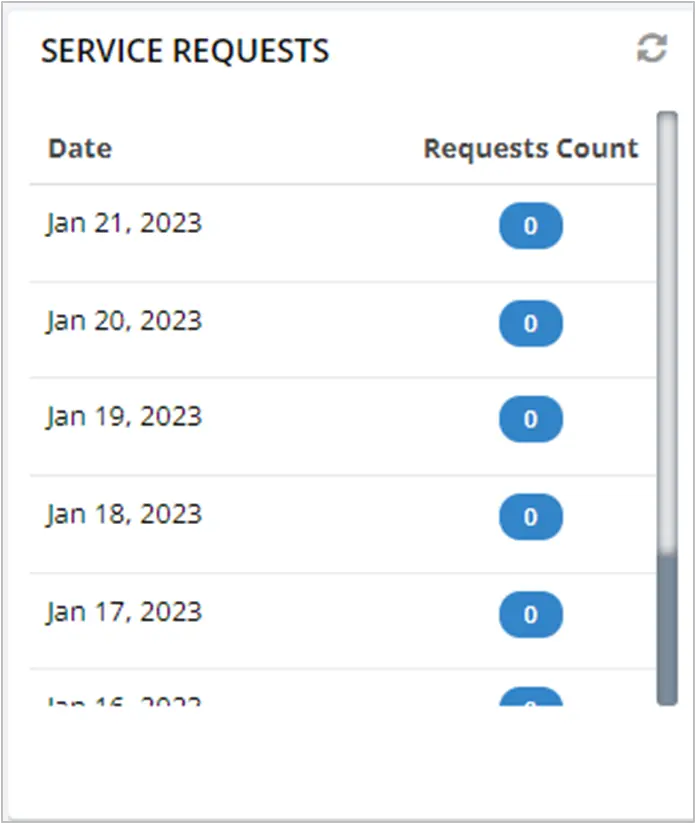
SERVICE REQUEST
- Attend to your customers timely, that have a submitted a request through your website.
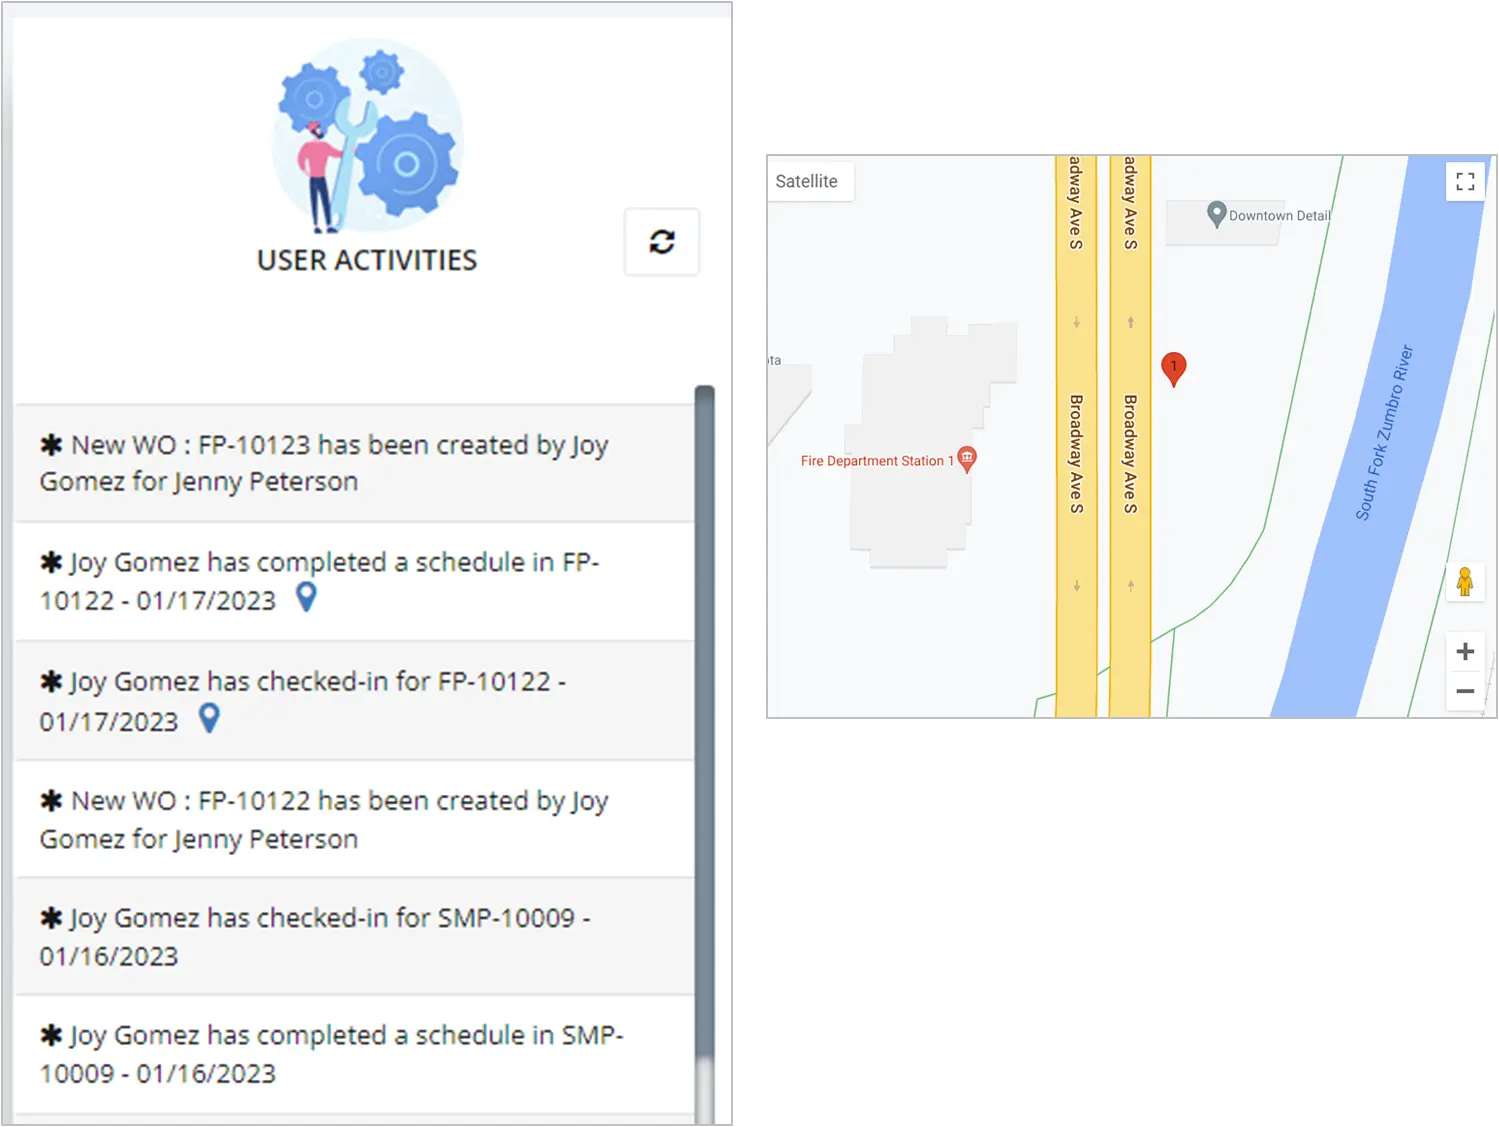
3. USER ACTIVITY:
- Monitor your Technician’s activities throughout the day. As your Technicians completes, the work you are notified through the User Activities List.
- Click on the activity to open up the work order.
- Click on the map icon to view where the Technician performed the activity.