Field Service Software
Automate & GrowYour Field Service Business
Gain full control over scheduling, dispatching, tracking, and invoicing with Field Promax. Fill in your email below and take our 14 Days free trial.
It's 100% free and we don't ask for your payment method details.

Automate Your Service Business With Our Exclusive Features
Trusted by
Our Clients
Our Clients
Features
Spend Less Time Managing and More Time Growing
Automate Your Service Business With Our Exclusive Features
Reports and Dashboard
Get comprehensive insights with custom reports and real-time dashboards that help you make data-driven decisions for your field service business.
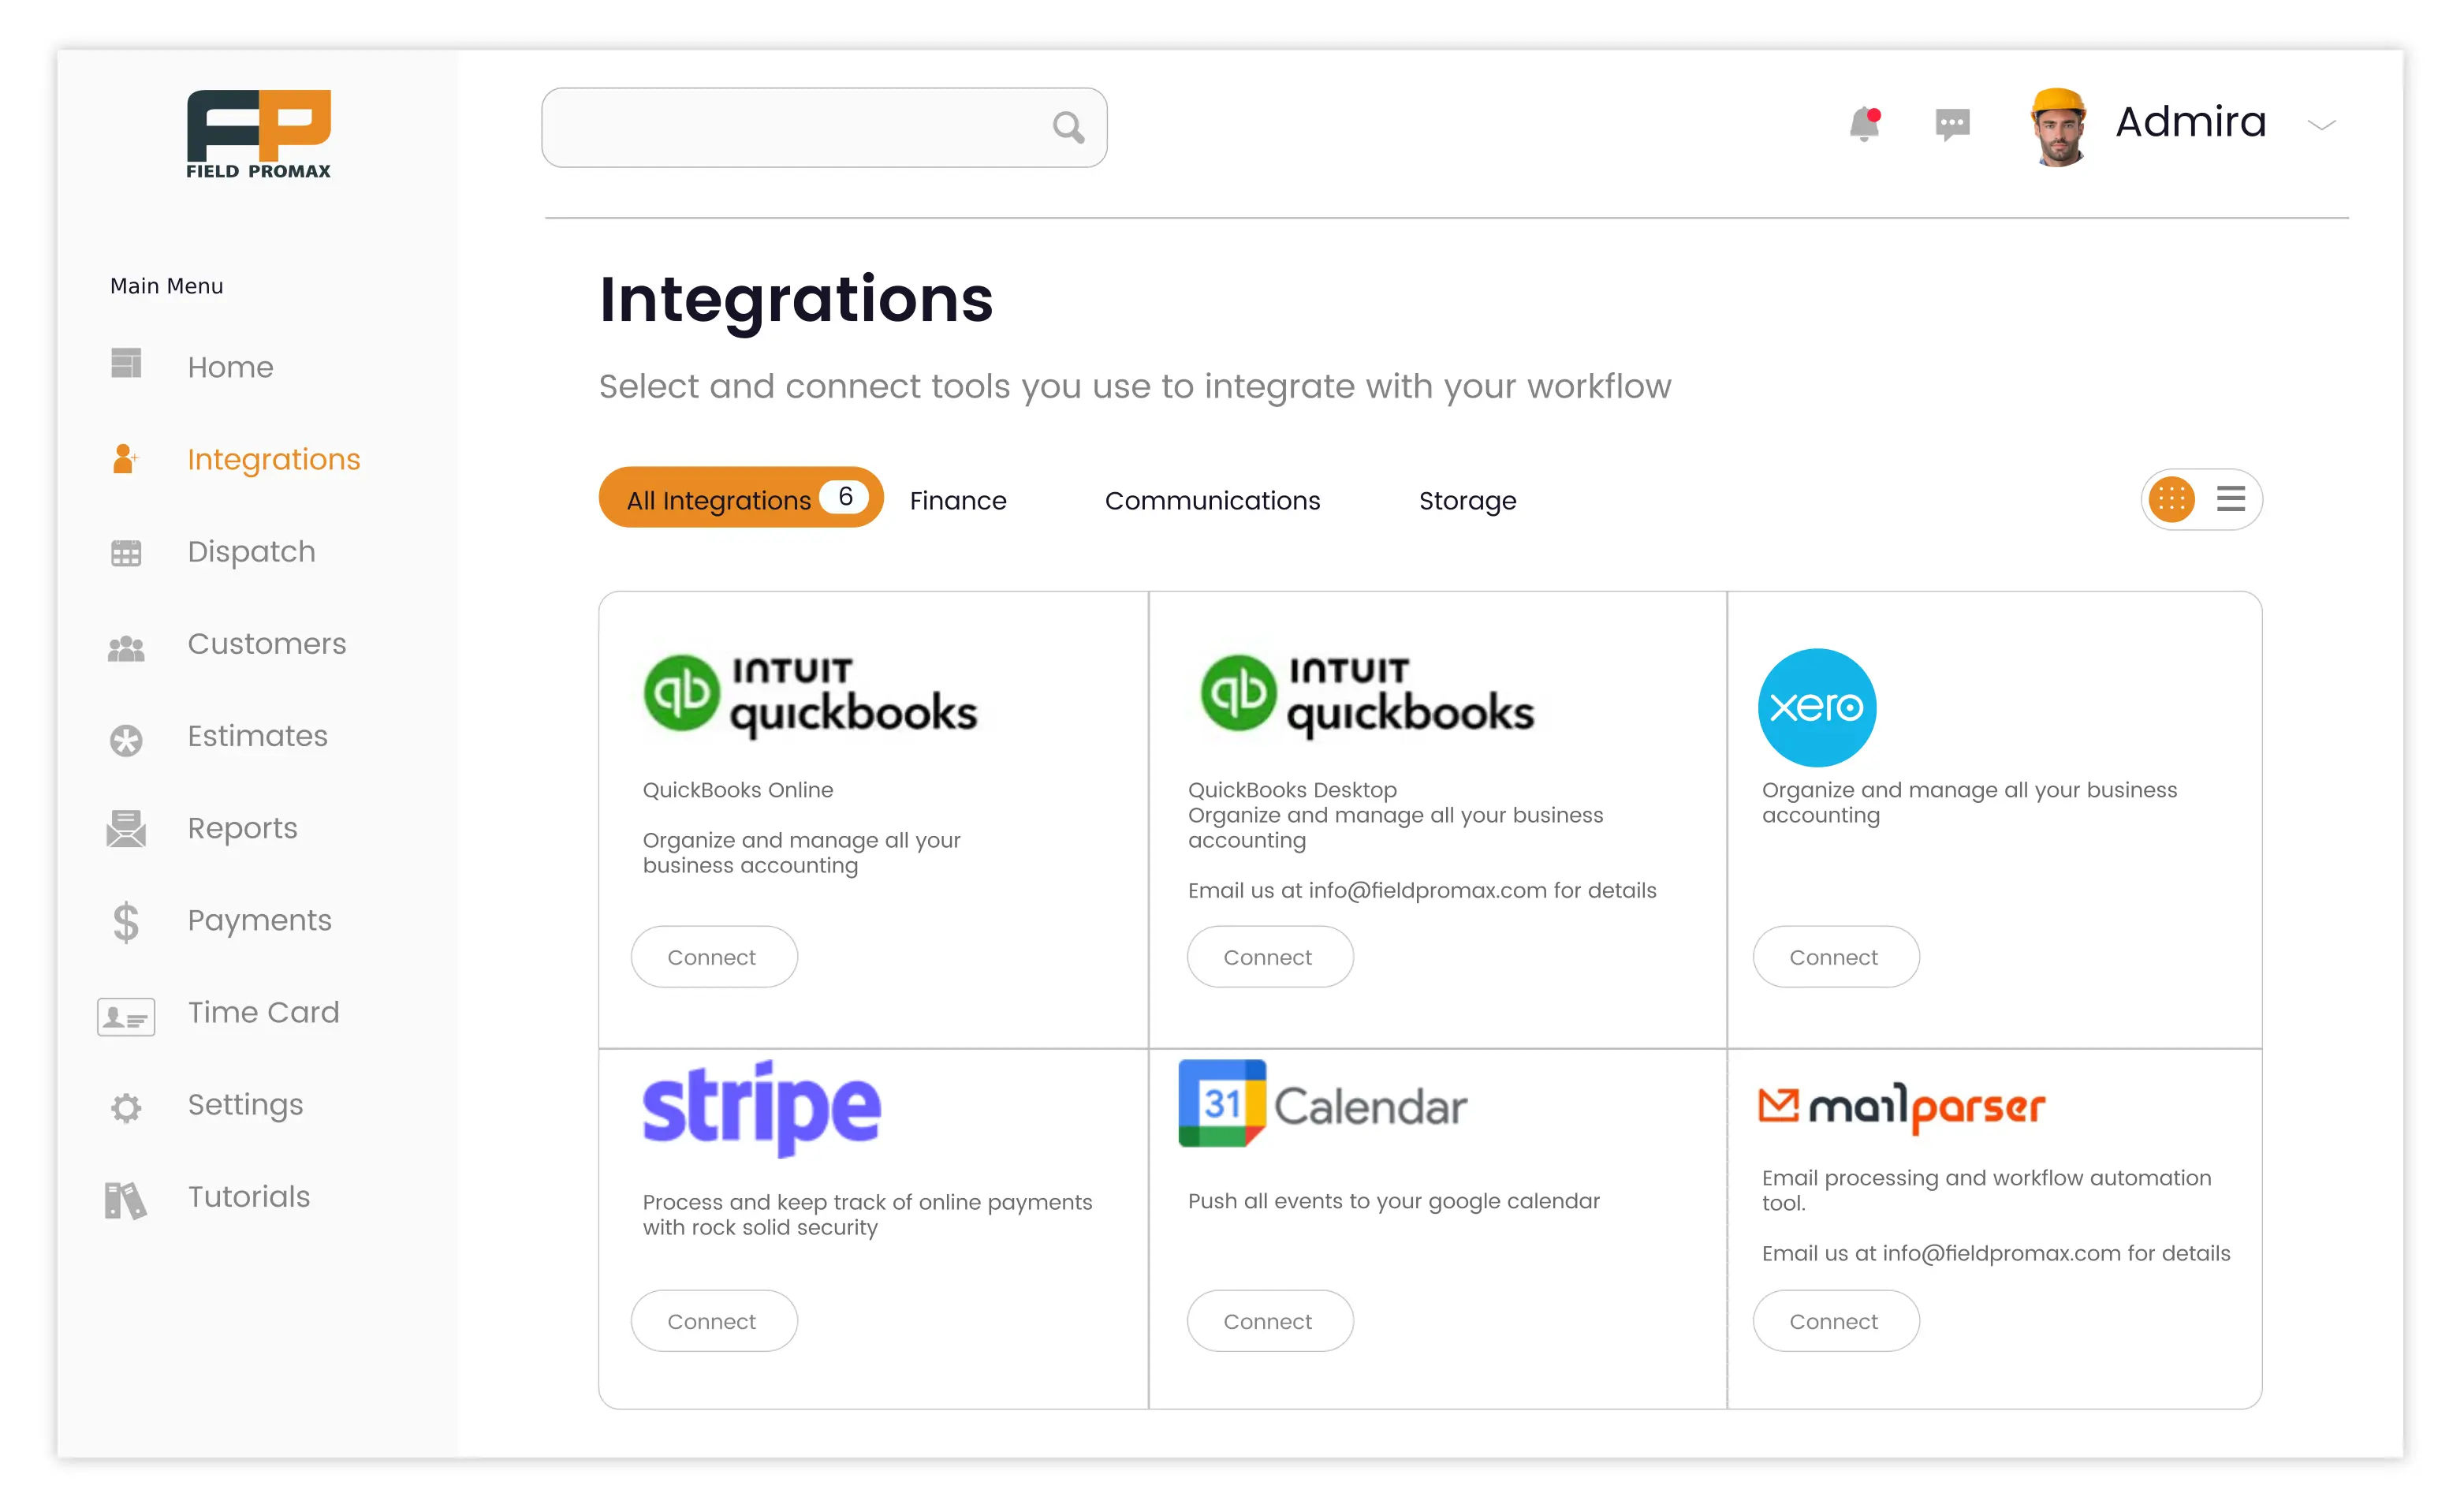
Learn More about Reports and DashboardTools & Integrations
Connect with your favorite tools and automate your workflow with our seamless integrations to QuickBooks, Xero, and other essential business software.
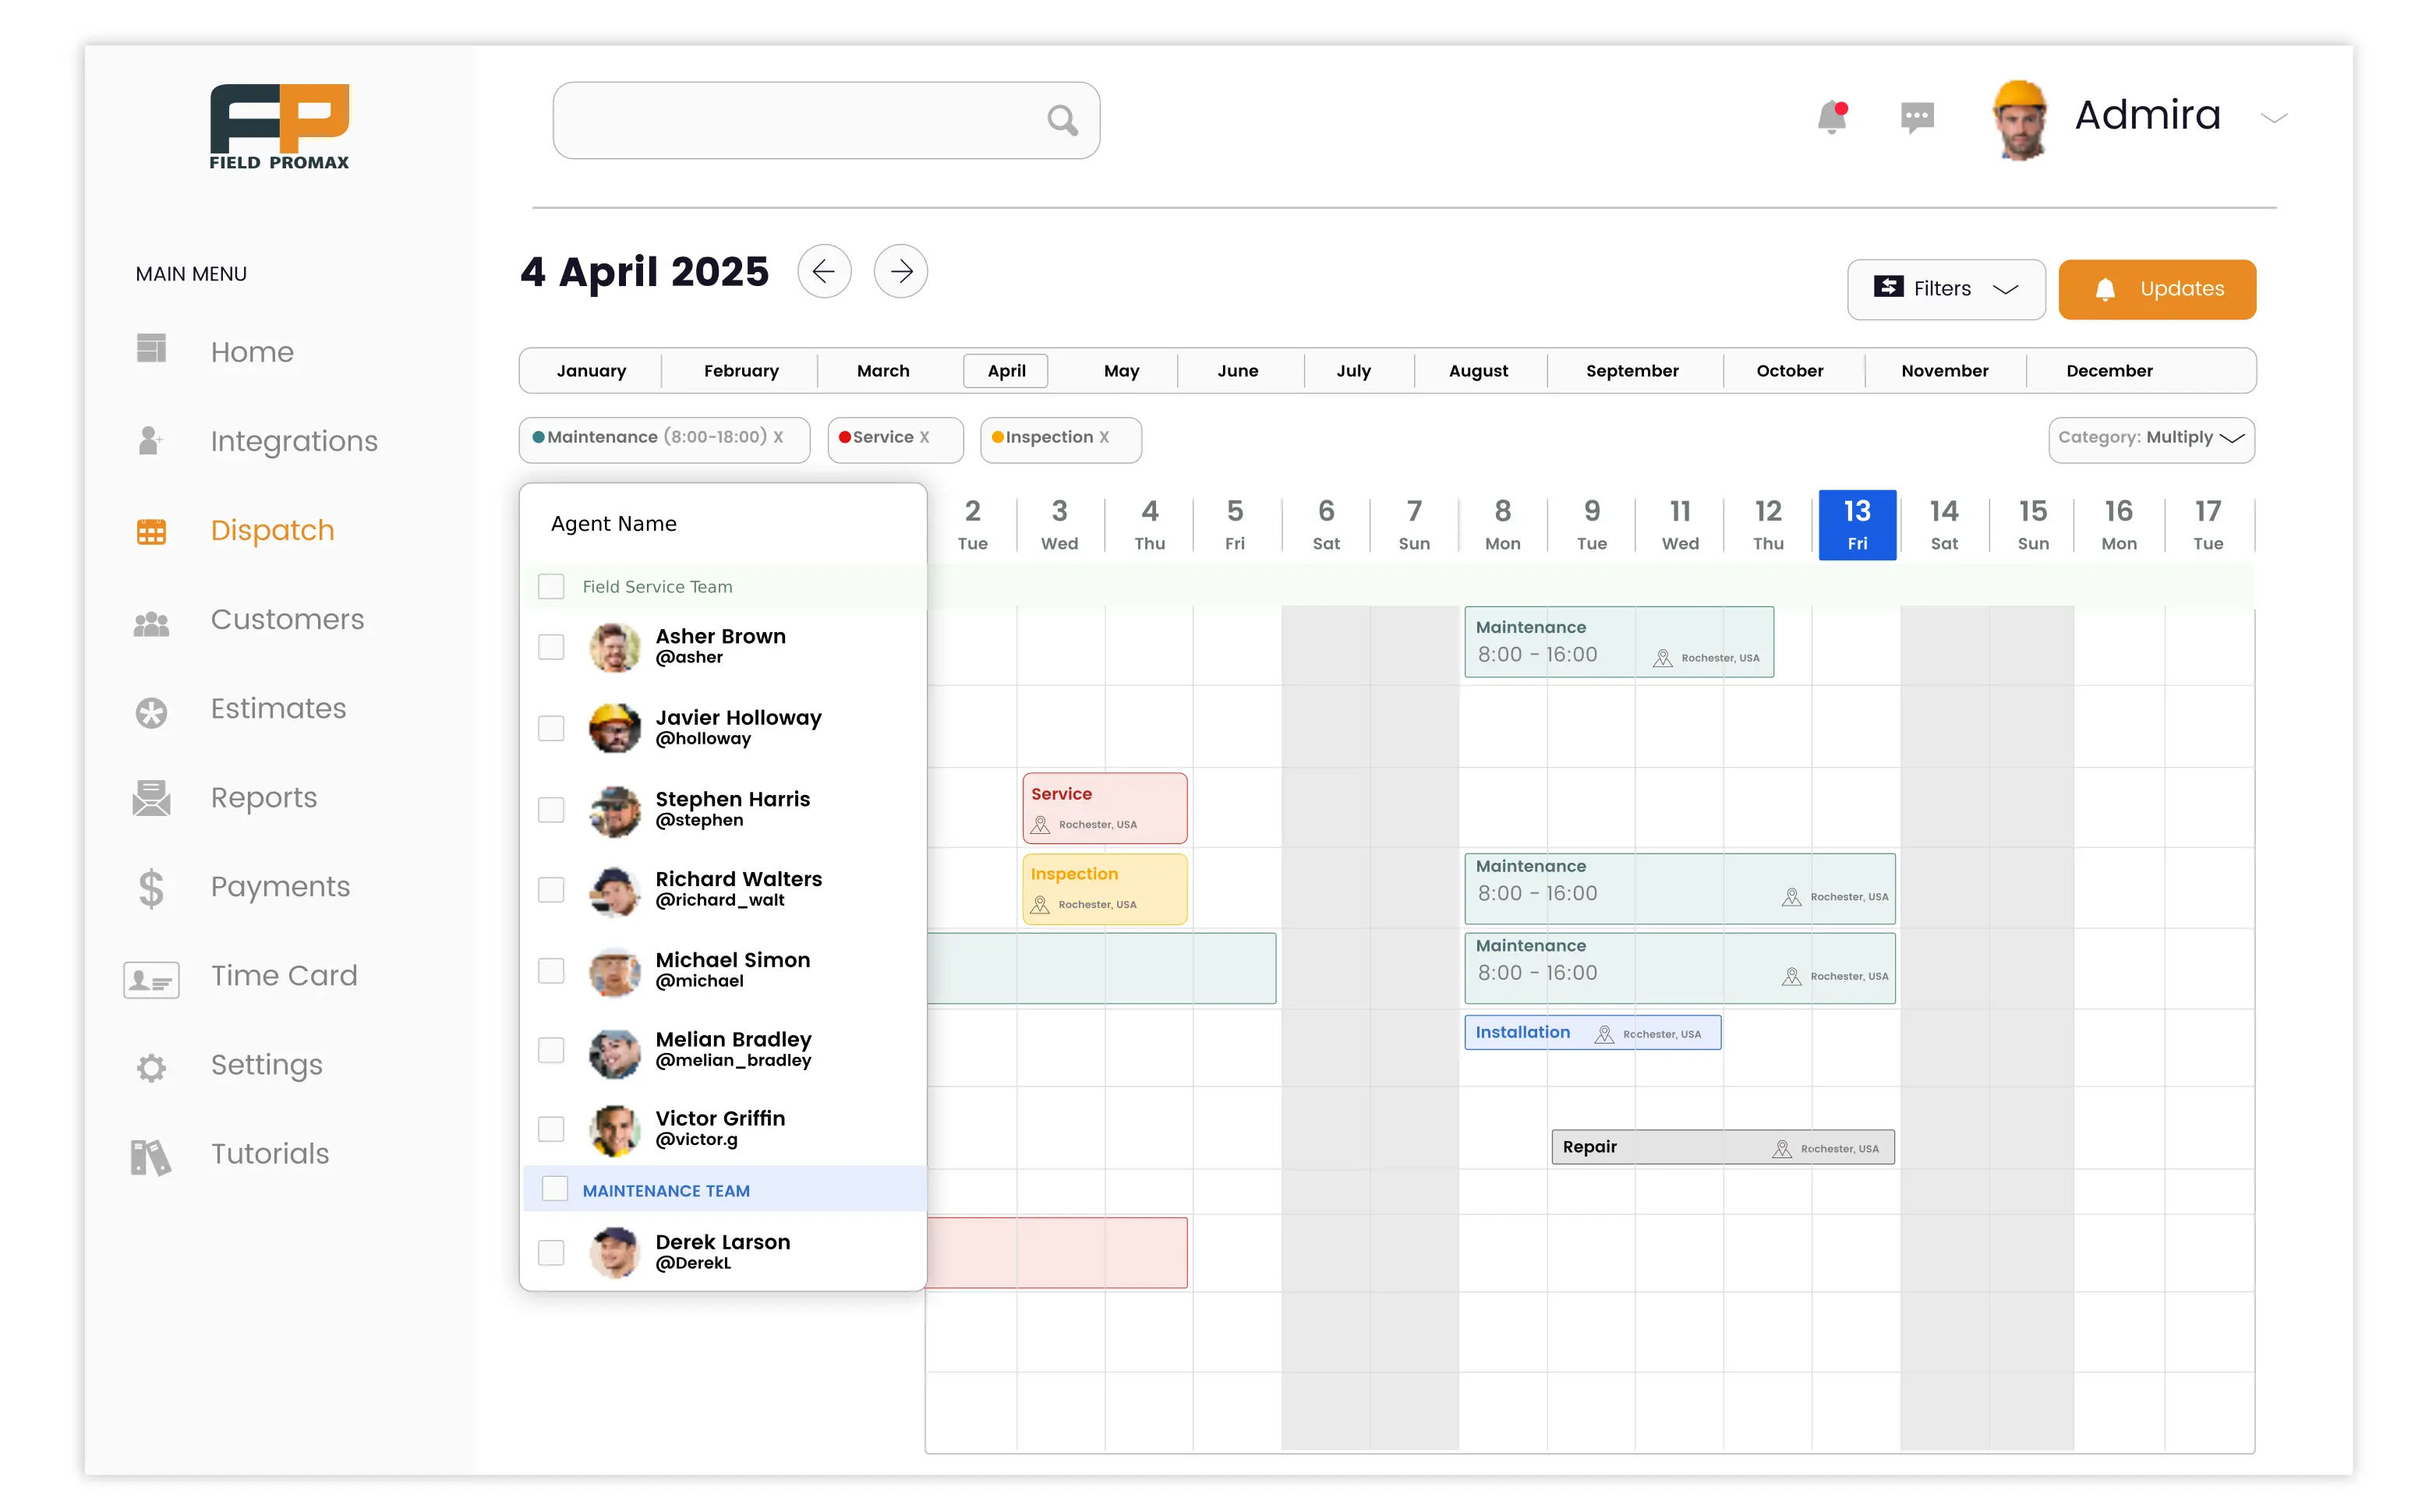
Learn More about Tools & IntegrationsSmart Scheduling
Optimize your team's schedule with AI-powered recommendations that maximize efficiency and reduce travel time between job sites.
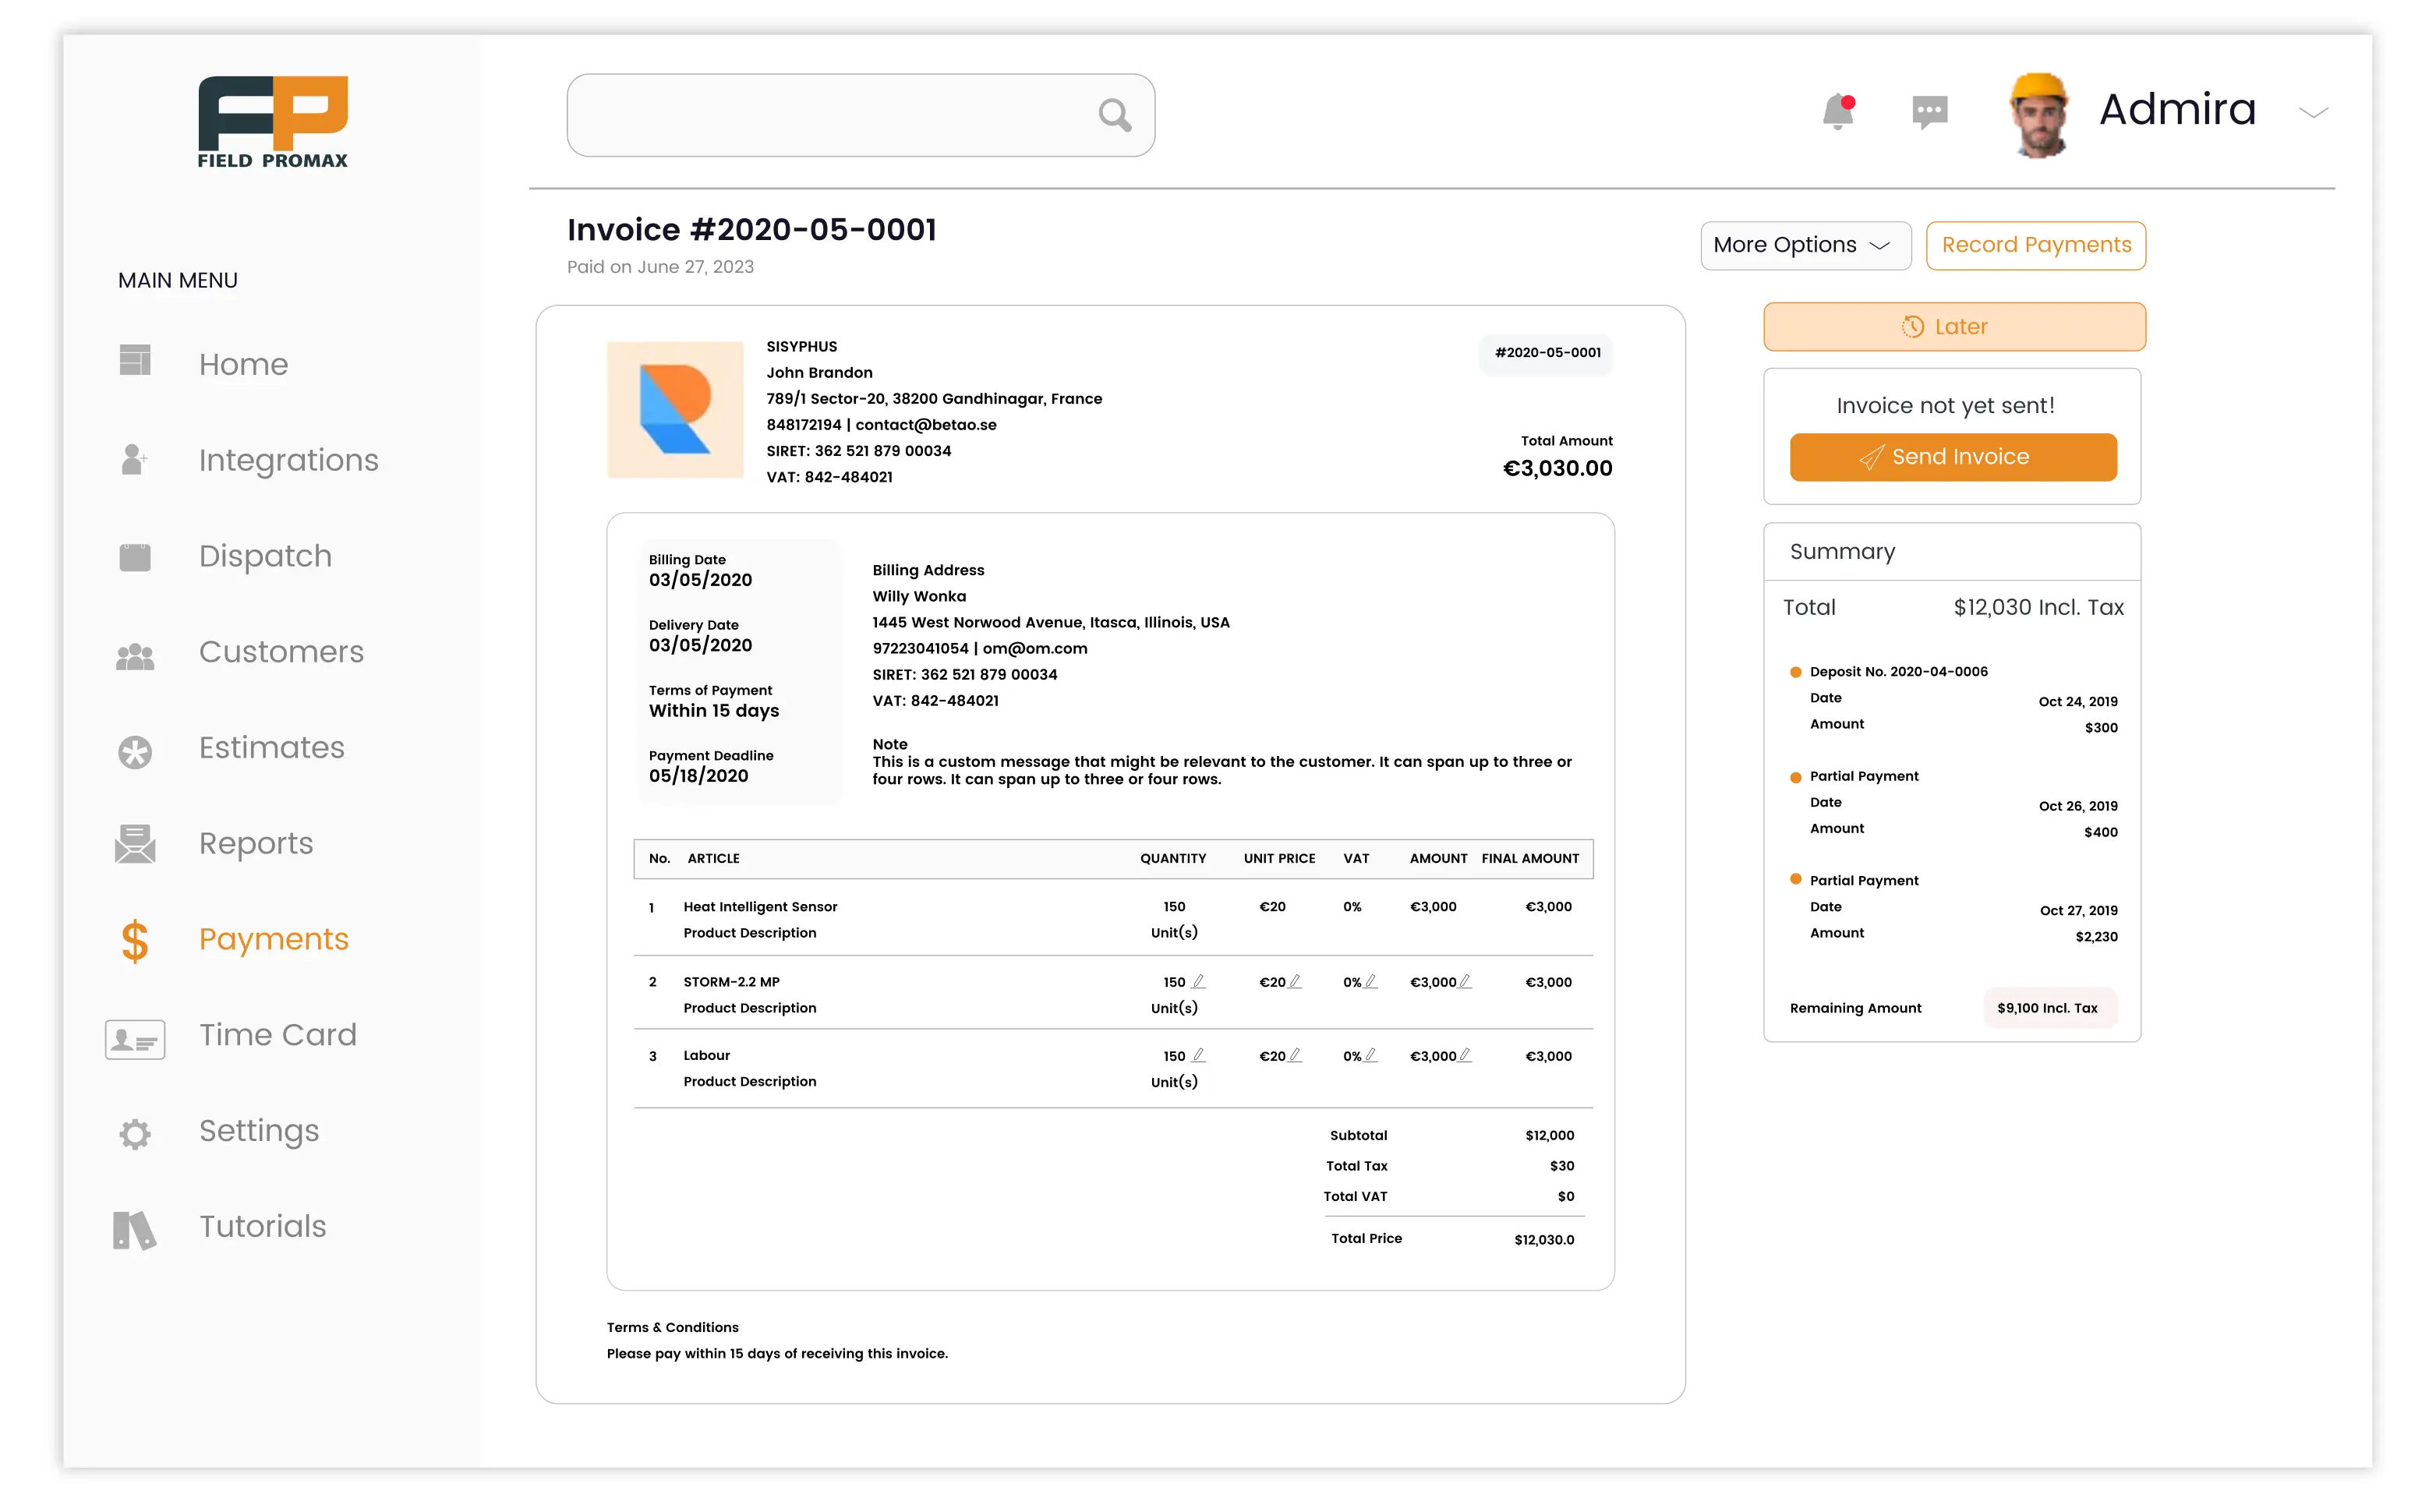
Learn More about Smart SchedulingInvoicing & Payments
Streamline your billing process, get paid faster, and maintain healthy cash flow with our integrated invoicing and payment solutions.
Learn More about Invoicing & Paymentspricing
Simple, transparent pricing
14-day free trial, with all features • Almost no learning curve • 99% customers recommend us
MonthlyAnnually

Blogs
Spend Less Time Managing and More Time Growing
Reviews & Feedback
Why customers love
working with us


We have been using Field Promax for a few years now. We are very happy with this program. The features are easy to use and to understand. Customer service is fantastic. I would recommend if someone was considering using this product.
Romeena De Silva
Elite Maintenance Services
Used this company since 2019 for our Plumbing business. We find it affordable, easy to schedule and nicely integrated with QuickBooks.
Maria M.
B and C Plumbing
This team is great. They are the most responsive vendor we deal with! FPM does what we need for scheduling our WOs and the reporting capabilities allow us to understand exactly what is going on. We also use their timecard reporting which is easy to use and provides accurate details of time spent.
Jane Cockerill
Outdoor Lighting
Been using this app for several years and it works great. They just did a change for me to the portal and it is now showing my customers info they requested. I have used many CRM / ticketing products and they are all way to over complicated. This does exactly what we need it to do without all the stuff most of us do not need or use.
T Woods
Pacific Access Control
The technical support has been a 10!!! This has been one of the best things I have done to help my small business. I tried couple of other programs but Field ProMax blows them out of the water.
Don Simpson
A-Z Tech